There are many types of forex traders, and each requires a different approach. Whether you choose a quick sprint of daily trading or a long marathon of positional trading, choosing the right style will increase your chances of success. The different trading styles depend on the period and length during which the trade is open.
What is a Trading Strategy?
A trading strategy is a fixed plan designed to generate profitable returns through long or short markets in finance. The main reasons a well-researched trading strategy helps are testability, measurability, consistency, and objectivity.
A trading strategy will use analysis to identify specific market conditions and price levels. While the fundamental analysis can be used to predict price movements, most strategies focus on specific technical indicators.
While there is a lot of confusion between “style” and “strategy”, there are some essential differences that every trader should be aware of that. While the style is a comprehensive plan of how often you trade and how long you keep your positions open, the strategy is a particular methodology for determining which price points you will enter and exit trades.
What is the Stock Market Rotation?
The stock rotation occurs when a trader moves their money from one sector to another, from one country to another, or out of the market in money, bonds, or real estate. A stock rotation strategy involves moving money in an attempt to beat the market.
If you are trying to invest in stock market trading, use these trading strategies. These trading strategies are a combination of a low-cost index to achieve long-term profitability.
Types of Trading Strategies
There are three main types of Forex trading strategies: Scalping, Hedging, and Position Trading. Here is the latest list of all types of trading strategies that you should know about.
1. Scalping Trading
Scalping is the shortest type of trading, who hold positions open for seconds or minutes. These short-term trades target small price movements throughout the day. The goal is to make very fast trades with less profit, but allow profits to accumulate throughout the day due to the large number of trades being made in each trading session.
This style of trading requires tight spreads and liquid markets. As a result, scalpers tend only to trade major currency pairs (due to liquidity and high trading volume) such as EURUSD, GBPUSD and USDJPY.
They also tend to trade only during the trading day’s busiest hours, during overlapping trading sessions, when trading volume increases and is often volatile. Scalpers look for the tightest spreads possible simply because they enter the market so often that paying the wider spread eats up the potential profit.
The fast-paced trading environment that tries to scalp as many pips as possible during a trading day can be stressful for many traders and widely time-consuming given the fact that you will have to focus on charts for several hours. Since scalping can be intense, scalpers usually trade one or two pairs.
Scalping becomes too intense over time. Part-time traders do not usually use this style as it requires a lot of dedication to monitor the market and conduct analysis.
2. Day Trading
For those who don’t feel comfortable about scalp trading intensity but still do not want to hold positions overnight, day trading may be appropriate.
Day traders open and close their positions on the same day (as opposed to swing and position traders), which eliminates the risk of large overnight moves. They close their position either at a profit or at a loss. Trades are usually conducted within minutes or hours, and as a result, it takes time to analyze the markets and track positions frequently throughout the day. Like scalp traders, intraday traders often rely on small profits to make a profit.
Day trading takes time, attention and commitment to a trading plan. This involves making a large number of trades with relatively little profit compared to trading positions – this makes it vital that day traders resist the temptation to take a losing trade as this could ruin their profits. To reduce the risk of losses, day traders often use stops and limits. Linking to the stop-loss position will allow the trader to keep their risk at a certain level, and the restrictions will block any profit.
Other types of trading styles may fall under the category of day trading – for example, swing trading and scalping – as they often involve opening and closing positions in one day.
3. Swing Trading
Unlike intraday traders, who hold positions for less than one day, swing traders usually hold positions for several days, and sometimes for several weeks. Since positions are held for a specific period to capture short-term market movements, traders do not need always to sit and watch their charts and their trades throughout the day.
This makes it a popular trading style for those who have other commitments (such as full time) and would like to trade in their spare time. However, it would help if you spent several hours a day analyzing the markets.
Swing traders (and some day traders) tend to use trading strategies such as trading, countertrend trading, momentum and breakout.
The main goal of swing trading is to spot a trend and then take advantage of the ups and downs that provide entry points. The swing trader will use technical analysis to identify these key price points. They look for two types of market movement: a “swing high” when the price moves up and a “swing low” when the market price falls.
The swing low indicates the opportunity to buy a long position or sell a short position. The swing high indicates the chance to sell a long position or open a short position. Swing traders often look for high volatility markets as these are the markets where swings are most likely.
There is no timeframe for swing trading as it depends entirely on how long each trend lasts. It could be an hour or a week. Swing trades will be closed only when the goal is achieved – to win or stop the position. This is the preferred method for traders who do not want to spend all day watching the market but do not want to take a long position.
4. Position Trading
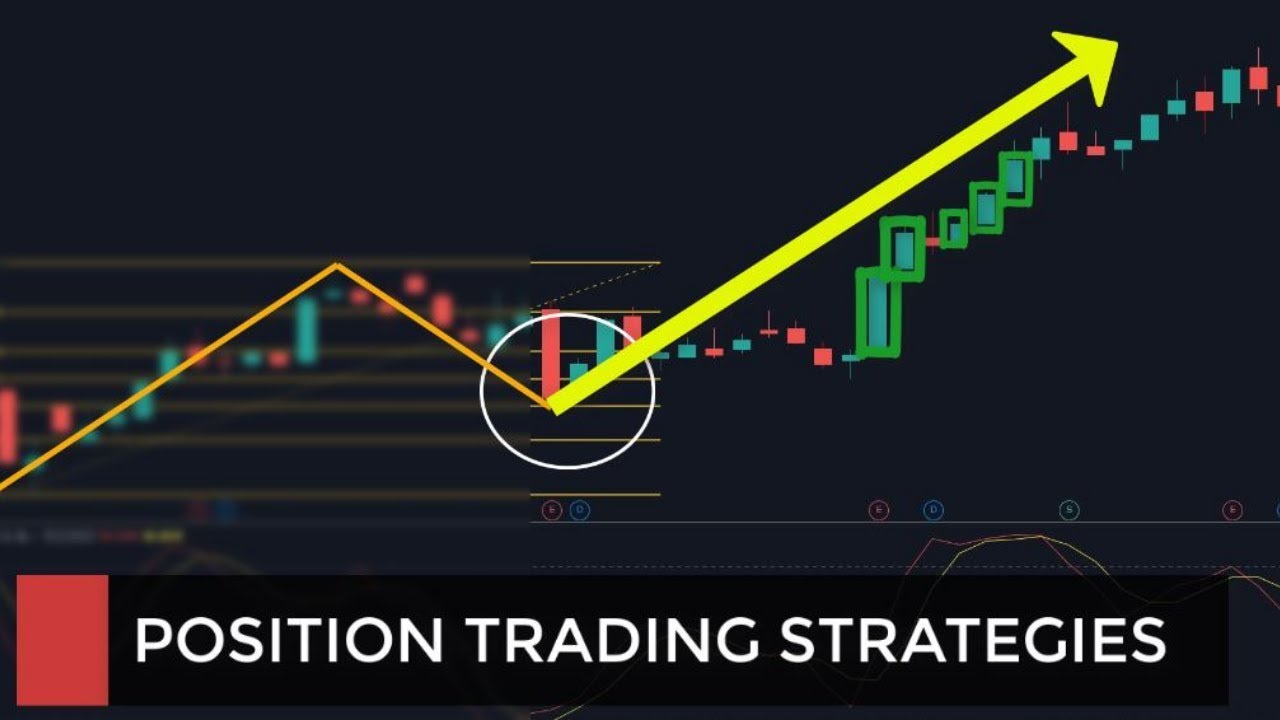
Position trading involves trading over a long period of time, be it weeks, months, or even years. Position traders do not worry about short-term market fluctuations – they focus instead on the overall market trend.
Some believe that positional trading is a buy and hold strategy and not active trading. However, positional trading performed by an experienced trader can be a form of active trading. Positional trading uses long-term charts – anywhere from daily to monthly – combined with other methods to determine the trend of the current market direction. This type of trading can last from a few days to several weeks, sometimes longer, depending on the movement.
Trend traders look for successive higher highs or lower highs to determine the trend of a security. By jumping and riding the “wave”, trend traders seek to take advantage of both the ups and downs of market movements. Trend traders seek to determine the market’s direction but do not try to predict price levels. Trend traders usually jump to the trend after it has taken hold, and when the trend breaks, they typically leave the position. It is more difficult to follow the trend during periods of high market volatility, and its position usually narrows.
5.Range Trading
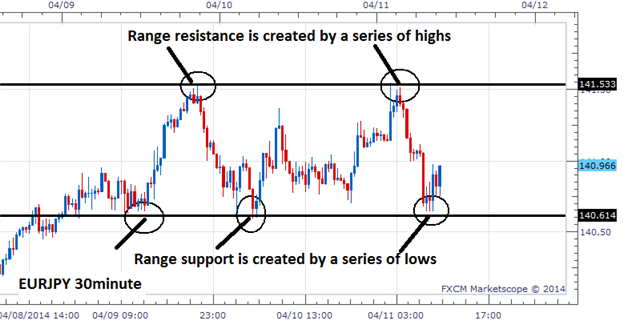
Range trading is a strategy in which the trader identifies overbought and oversold zones (or support and resistance areas) and buys in the oversold area (support) and sells in the overbought area (resistance). This strategy works well in markets that move up and down without a noticeable long-term trend. The strategy is less effective with a market trend but can be used if market orientation is considered.
While trend traders focus on the overall trend, range traders will focus on short-term price swings. They enter long positions when the price moves between two clear levels and does not break above or below.
This is a popular strategy for trading forex as many traders hold the idea that currencies remain in a strict trading range with significant variability between these levels. This means that short-term traders can try to take advantage of these swings between known support and resistance levels.
A range trade goal is to find a point where the price is too high or below the average price and should retreat like an elastic band and find a point where resistance or support has formed and is likely to hold again.
6. Pairs Trading
The pair trader tries to take advantage of the market imbalance between two or more financial instruments, such as stocks or funds, in anticipation of earnings when the inequality is corrected.
Pair trading is a non-targeted relative value investment strategy that seeks to identify two companies or funds with similar characteristics currently trading at a price ratio that falls outside their historical trading range. This investment strategy will result in the purchase of undervalued security and the simultaneous sale of its overvalued security while maintaining market neutrality. It can also be called market neutral or statistical arbitrage.
7. Momentum Trading Strategies
Momentum style traders believes that these trends will continue to move in the same direction due to their momentum that is already behind them.
Momentum investing is a trading strategy in which investors buy stocks rallying and sell them when they seem to be at their peak. The goal is to cope with volatility by finding opportunities to buy in short-term uptrends and then sell when the stock starts to lose momentum.
8. High-frequency Trading
High-frequency trading, also known as HFT, is a trading method that uses robust computer programs to process large numbers of orders in a fraction of a second. It uses sophisticated algorithms to analyze multiple markets and execute orders based on market conditions.
Since some of these styles require rapid responses from traders, interest in high-frequency trading (HFT) is growing. It is an algorithmic trading method that large organizations use to fill massive quantities of orders in a matter of seconds.
However, it is not classified as a trading style in a broad sense as it is based on the underlying technology of the transaction and not on the trader’s personal preference or plan. HFT is also not widely available to individual traders, which means they cannot work with large organizations.
9. Trend Trading
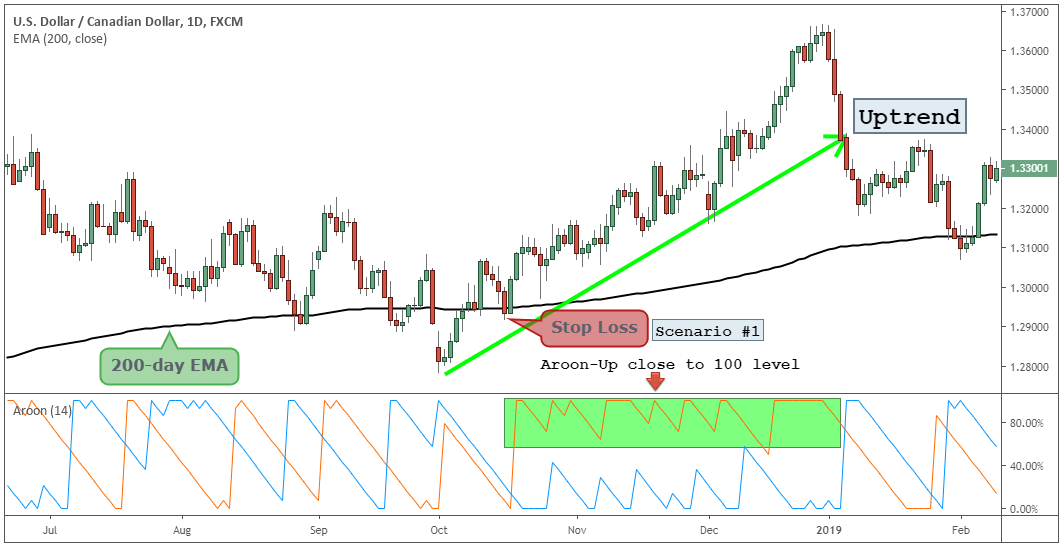
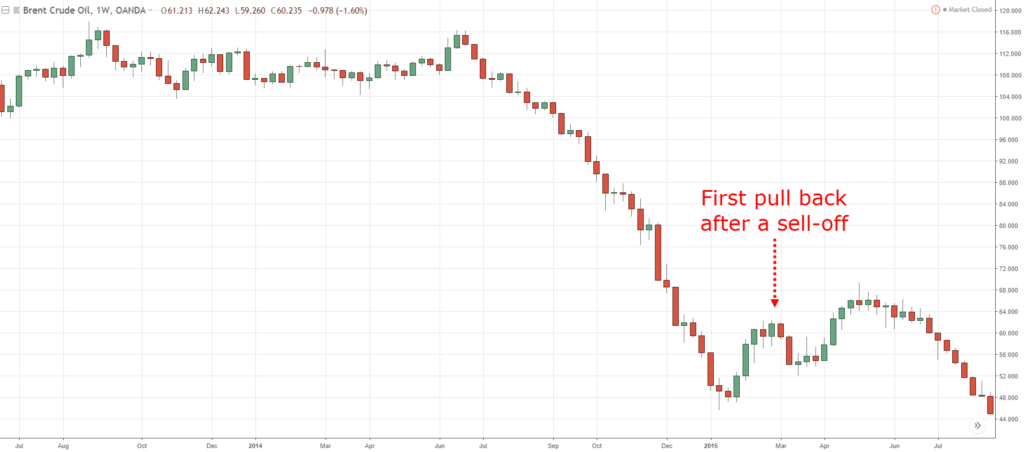
Trend trading is a trading style that attempts to capture profits by analyzing an asset’s momentum in a specific direction. When the price moves in a general direction, such as up or down, it is called a trend. Trend traders go long when a security is trending upward.
A trend trading strategy is based on technical analysis to determine the direction of the market movement. This is generally considered a medium-term strategy and is best suited for position traders or swing traders as each position will remain open as long as the trend continues.
The price of an asset can move both up and down. If you were to enter a long position, you would do so when you think the market will make higher peaks. If you were to go short, you would if you thought the market would hit lower lows.
10. Breakout Trading
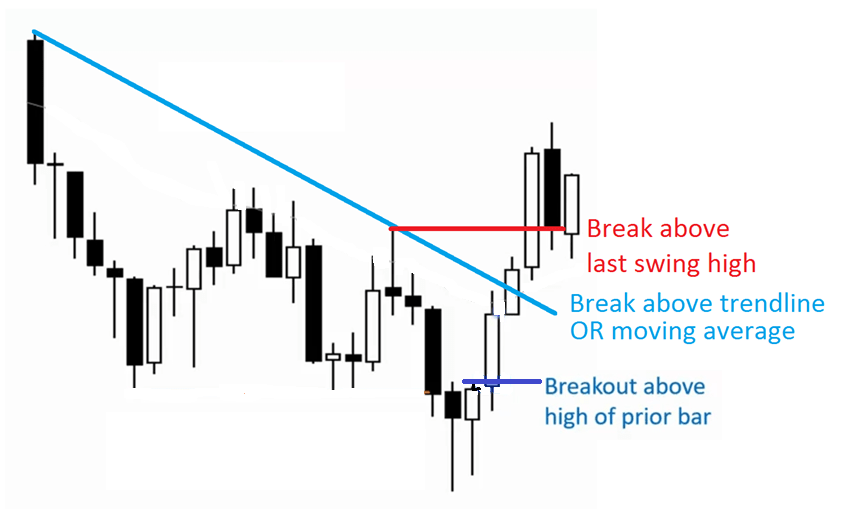
A breakout is a stock price that, with increased volume, breaks out of a specific support or resistance level. A breakout trader enters a long position after the stock price breaks above the resistance level or enters a short position after the stock breaks below the support level. Breakouts occur in all types of market conditions.
Traders using this strategy will look for price points that indicate the beginning of a period of volatility or change in market sentiment – by entering the market at the right level, these breakout traders can manage movement from start to finish. Typically, limit-entry order is placed with a level near support or resistance levels, so that each breakout automatically becomes a trade.
Most breakout trading strategies are based on volume levels, as theory suggests that when volume levels start to rise, there will soon be a breakout of support or resistance levels. Thus, popular indicators include the money flow index (MFI), on-balance volume and volume-weighted moving average.
11. Reversal Trading
A reversal is a change in the direction of a price trend from upward to downward. Traders try to exit positions aligned with the trend before the reversal, or exit after they see the reversal occur. After the reversal, the strategy will acquire many of the characteristics of a trend trading strategy, since it can last for different periods of time.
A reversal can happen in both directions as it is merely a turning point in market sentiment. A bullish reversal indicates that the market is at the bottom of a downtrend and will soon move into an uptrend. At the same time, a bearish reversal indicates that the market is at the top of an uptrend and is likely to move into a downtrend.
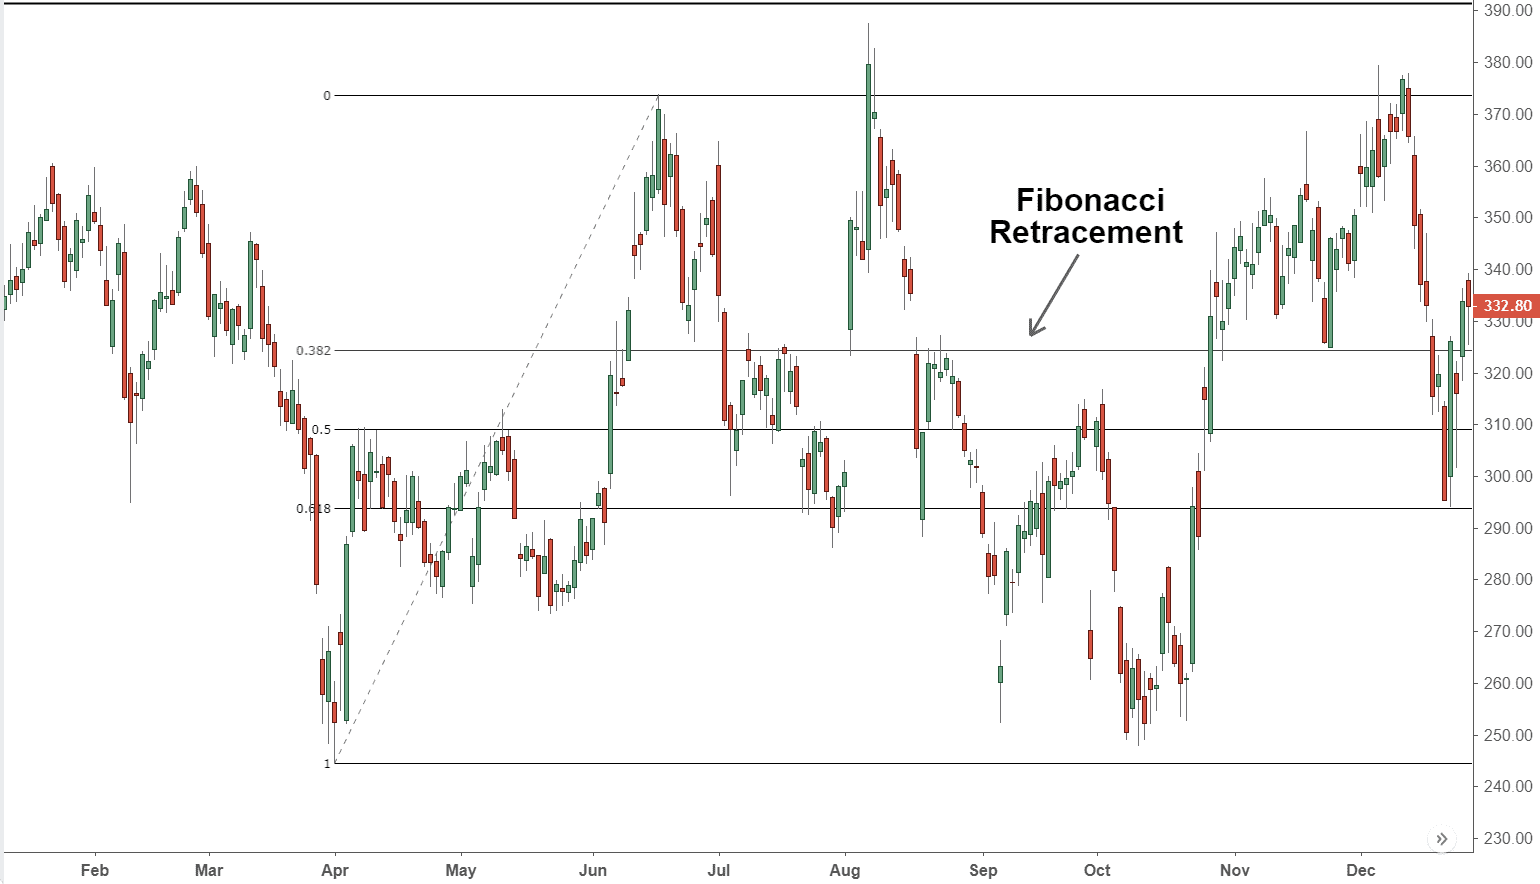
When trading reversals, it is essential to make sure that the market is not just tracking. A Fibonacci retracement is a standard tool used to confirm whether the market is above known retracement levels. It is worth noting that some believe that the Fibonacci change is a self-fulfilling prophecy, as many orders will gather around these levels and push the price in the desired direction.
It is essential to combine technical indicators with other analysis forms, be it other technological tools or fundamental analysis.
12. Pivot Points Trading
A day pivot point trading strategy can be fantastic for identifying and targeting critical support and resistance levels. This is especially useful in the forex market. Range-bound traders can also use it to identify entry points, while trends and breakout traders can use pivot points to identify key levels that need to be overcome to move to a breakout.
13. News Trading
A news trading strategy involves trading based on news and market expectations before and after the news release. Trading on news announcements can require skilled thinking as news can travel very quickly in digital media. Traders will need to evaluate the news as soon as it is released and quickly assess how to trade it.
When trading based on news releases, it is vital that the trader knows how the markets work. Markets need the energy to move, which comes from the flow of information such as news reports. Therefore, the news is usually included in the value of the asset price. This results from traders trying to predict the outcome of future news releases and, in turn, the market reaction.
14. Technical Analysis
Technical analysis is another important category of currency trading strategies that is in high demand among traders. More often than not, this involves analyzing the past and recent behavior of currency price trends on a chart to determine where they might move next. The rationale for using technical analysis is that many traders believe that market movements are ultimately driven by the psychology of supply, demand and mass market, which sets limits and ranges for the up and down trend of currency prices.
The technical analysis encompasses a long list of individual methods used to identify likely currency trends. Many traders value technical analysis because they believe it provides them with an objective, visual, and scientific basis for determining when to buy and sell a currency.
15. Fundamental Analysis
Fundamental analyst tracks the leading indicators of the economy. As a result, you will understand whether a currency is overvalued or undervalued and how it compares to another asset class. However, fundamental analysis is challenging because it includes various economic elements that indicate future trends in trade and investment.
As a newbie to the stock market, start with the basics by analyzing the inflows and outflows of securities. The national banking sector often publishes them. Also, the analyst can rely on data messages and news from the opposite future trend. Fundamental analysis is used to account for an asset where the balance of supply and demand is a critical trend-changing factor—for example, crude oil, where you should read the oil price impact.
16. End-of-day Trading Strategy
The end-of-day trading strategy involves trading near to the close of the markets. End-of-day Traders become active when it is clear that the price will be “settle” or close.
This strategy requires examining the price movement in comparison to the previous day’s movement. Traders can reflect on how the price might move based on price movement and decide which indicators they use in their system. Traders must create a set of risk management orders, including limit orders, stop-loss order, and profit to reduce risk at night.
This style of trading is less time consuming than other trading strategies. This is because it is only necessary to study the charts during the opening and closing times.
17. Bollinger Bands
It combines moving averages and standard deviations to determine price factors. The 20-day moving average is combined with the upper and lower bands, determined by adding and subtracting two standard deviations to the 20-day moving average.
18. Commodity Channel Index
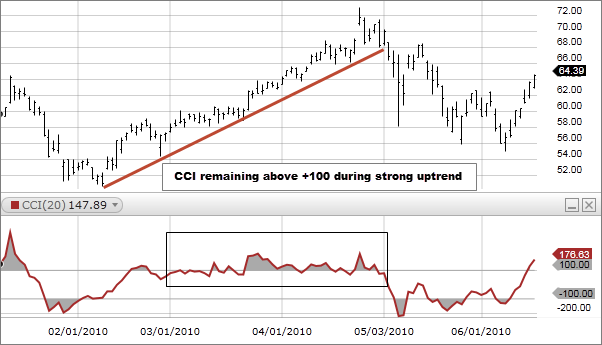
It measures the difference between the current price and the historical average price (calculated over time). An unbounded indicator above zero suggests that the price is above the historical average, while a reading below zero indicates that the price is below the historical average.
19. William %R
A momentum indicator is used to determine overbought and oversold levels and is calculated for 14 days/weeks/months/quarters. It shows the current price level relative to the highest high for the last specified 14-day period and ranges from 0 to -100.
20. Rate of Change (RoC)
Compares the percentage change in the current price with the previous ‘n’ price. The “N” is not fixed. RoC moves around the zero lines and fluctuates in positive and negative areas.
21. K-Band
It combines moving averages with a true average range (ATR), a measure of volatility. Upper and lower limits are created by multiplying the ATR by a specific multiplier and adding and subtracting that same value from the moving average line. Thus, the moving average acts as a middle line with upper and lower limits.
22. Rex Oscillator
A measure of market behavior based on the relationship between the close, open, low, and high stock/index values. It is a moving average TVB (True value of Bar) calculated by subtracting the total of the lower, open, and upper values from three times closer values.
23. Stochastics
The indicator is assumed to be highly accurate and operates under the assumption that when a stock trends upwards, the close price is at the high end of the daily range, which is the high price minus the low. Whereas when a stock has a downward trend, the closing price is at the bottom of the day’s range. Includes construction of two lines, like “K” line and the “D”.
24. Retracement
Retracement strategies are based on the idea that prices never move in a perfectly straight line between highs and lows and usually stop and reverse in the middle of their more extensive paths between solid support and resistance levels.
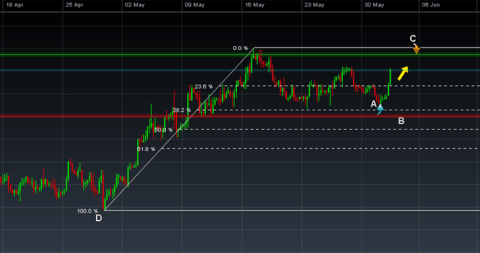
With this in mind, retracement traders will wait for the price to retreat, or “retrace” part of their movement in confirmation of the trend, before buying or selling to take advantage of the longer and more likely price movement in a specific direction. Traders often choose a certain percentage of the move as a confirmation sign (e.g. 50%) or rely on Fibonacci ratios (23.6%, 38.2%, or 61.8%) to determine optimal entry and exit points for trades.
25. Carry Trade
Carry trade is a particular category of foreign exchange trading that maximizes profits through the difference in interest rates between the countries where the currencies are traded. Typically, the currency purchased and held the next day would pay the trader the country’s interbank interest rate in which the currency was purchased. Carry traders can search for a country’s currency with a low-interest rate to buy a country’s currency with a high-interest rate, thus capitalizing on the difference.
Traders can use a trend trading strategy in conjunction with carry-over trading to ensure that the difference in currency prices and the interest earned are complemented rather than compensated.
26. Event-driven Trader
Event-driven traders seek a fundamental analysis of technical charts to make decisions. They will seek to take advantage of surges caused by political or economic events, such as Non-Farm Payroll, GDP, employment figures and elections.
This type of trading is suitable for a person who loves to follow world news and understands how events can affect the markets. Curious, inquisitive and intelligent, you will be able to process new information and predict how global and local events might develop.
27. Contract-for-Difference (CFDs)
Contract with Difference (CFD) products are financial derivatives that provide retailers with a path to the world’s leading markets. CFD is a binding contract between a trader and a broker to exchange the difference in the price of a product from the moment it is opened until it closes.
CFDs allow participants to take advantage of the price movement of an underlying asset without actually owning it. Because transactions take place outside of standard exchanges, CFDs are considered OTC over-the-counter products.
Summary
Traders have a wide variety of strategies to try to interpret price movements and take profitable trading positions. Some traders may use an individual approach almost exclusively, while others may use different or hybrid versions of the strategies described above.
While no one guarantees that it will work all the time, traders may find it helpful to familiarize themselves with a range of strategies to create an arsenal of available tools to adapt to changing market conditions.
